| ATLAS F1 Volume 7, Issue 7 | |||
 |
Taking the Lid Off F1 Formula One Technical Analysis | ||
| by Will Gray, England | |||
|
Last year, Atlas F1 ran a series of articles that investigated the technical areas involved in design, development, and construction of an F1 car. Now, a year later, Will Gray picks up where he left off, and dives deeper into the technical analysis of Formula One.
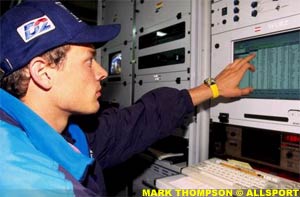
The F1 Fan receives a tiny amount of the information available during races: Lap times, split times, positions, and gap times, along with pit stop times keeps the viewer in the picture, and are also available constantly to every team at every race. This is all automated timing, with each car carrying a transponder that sends a signal every time it crosses the line, allowing a main computer to work out all the information required. On the pit wall, the Engineers have a monitor which constantly displays the lap times and race positions, and during practice and qualifying, portable monitors can be placed in front of the driver to give him the same information, or to display the television pictures seen on the screens around the track. Along with this, the teams often collect their own information, especially at test sessions. They will put up speed traps around the circuit, to monitor theirs and other cars' speeds and lap times, with the aim of gaining ideas on other teams' set-ups.
Data from every sensor on the car is recorded in real time (constantly recorded), such that at every single second the car is on (or off!) the track, all parts of the car are monitored, whether it be brake temperature, spring compression, or even the throttle pedal angle - no longer can a driver say "I took it flat out, honest", and get away with it! A very public display of the use of telemetry was at seen at the German Grand Prix in 1999, when Damon Hill parked his Jordan complaining of a brake problem. Telemetry showed the brakes were working perfectly and he should have carried on: Try explaining that one to Mr Jordan!
The basis of the telemetry display is a graph of one lap of the circuit, onto which any information recorded can be displayed. On the horizontal axis is the time in seconds, beginning at zero as the car passes the start line, and running on to the end of the lap, and on the vertical can be displayed any information obtained from the car. As an example, soon after the end of a session the telemetry is used in a debrief to show a driver how he performed. He may be shown a graph of his fastest lap, showing vehicle speed, throttle position, and brake position, and as a driver often wants to know why he was slower than his team-mate in certain parts of the lap, the data analysis program allows laps to be overlaid for a direct comparison.. In doing this, the differences between the two drivers' fastest laps are immediately apparent, and it can be clear from the curves where one driver’s acceleration rate may be slower, or where he brakes sooner than the other. It also shows up the difference in drivers' styles, and can be an interesting scientific display of the driver's balls!
Although this indicates where the problem is, it is the job of the data acquisition and race engineers to study further data and assess why the driver doesn't have as much confidence in that corner. Sometimes they come up with a reason, other times there are no clues and the driver is just informed he must try a little harder! This more detailed study is usually done between sessions, or at the end of the day once all running is complete. The data for the corners that the driver is slow through can be zoomed in on for further study. Then comes the reasoning - why is he slower? This is where the amount of data obtained through telemetry shows its worth.
The longitudinal g-force experienced by the driver was larger in both acceleration and deceleration, and returning to the initial data, it could be seen that throughout the corner both the power and the brakes were on, whereas the other driver’s data showed clear on and off periods for each - different styles of driving. The wheel loads are often the telling factor, as it is here that all load is transmitted to the racetrack, be it mechanical or aero. Through the corner, the overall loading was similar, but the slower driver's wheels were significantly less loaded at the front, with a lower rate of increase in loading, which suggests the car was less responsive. Looking at the left-right balance showed the lefts having more fluctuation, with the inside wheel lifting briefly before and after the apex (shown by a negative force), and the right front locking up. Finally, the percentage front roll was much higher before and after the apex, so stiffness seemed to be the problem, and it was concluded that the rear roll bar should be softened. The driver went quicker immediately after the change.
This is just a small amount of the data available for analysis, and separate teams are set-up for engine, car dynamics, and car electronics. However, it is this analysis as much as the driver’s skill which gets the best speed out the car.
|

| Will Gray | © 2007 autosport.com |
| Send comments to: gray@atlasf1.com | Terms & Conditions |